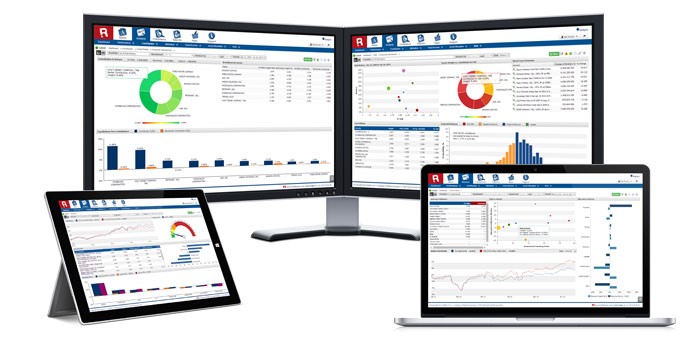
My Risk Mentoris an advanced forex myriskmentor analytics engine that gives you an integrated view of your finances. Whether you want to keep track of your personal investments or monitor an enterprise-level portfolio, We have a solution for you. It is a cloud based solution, which means you do not have to own the infrastructure and can use the services directly and when you need them. It allows you to upload myriskmentor data from a number of sources, such as:
Trades from CSV Files with a
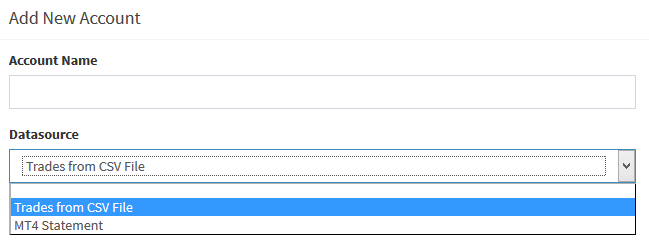
Once you create a new account, you can pick an appropriate data source from the dropdown menu, as you can see in the following image:
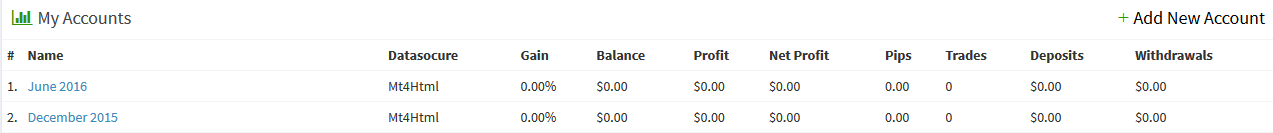
Once a file with a suitable format is uploaded, your application is ready to work. My Risk Mentor gives you the scalability to upload multiple files (in any of the five formats mentioned), which can easily be tracked by giving them a name and a description. Multiple portfolios will appear in your dashboard, as shown in the screenshot below:
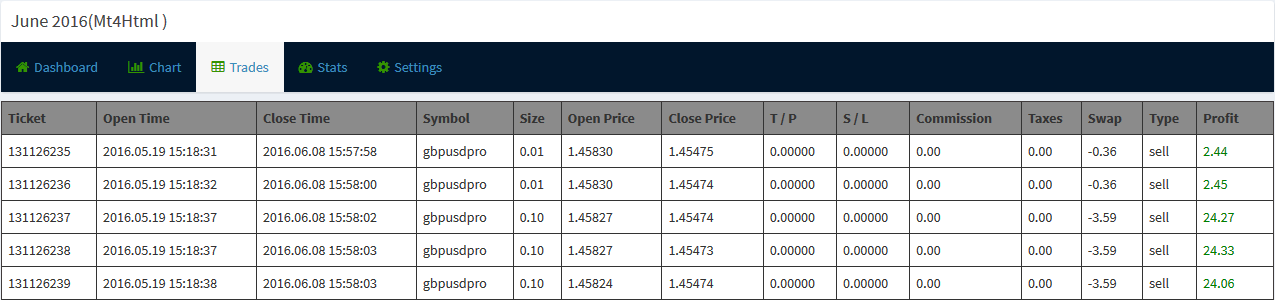
Trades
Your Dashboard gives you a bird’s eye view of your portfolio. If you have an eye for detail and would like to see all of the transactions that took place during a given time period, there is a separate “Trades” tab dedicated to this. While the Main Stats section contains the total number of trades, the “Trades” tab lists the details of each of them (such as opening time, closing time, symbol, size, prices, etc.). In addition, it contains important information such as Closed Trades, Cancelled Trades, Open Trades, Open Orders and Administration. These reports can easily be exported to a PDF file or Excel workbook for further analysis.
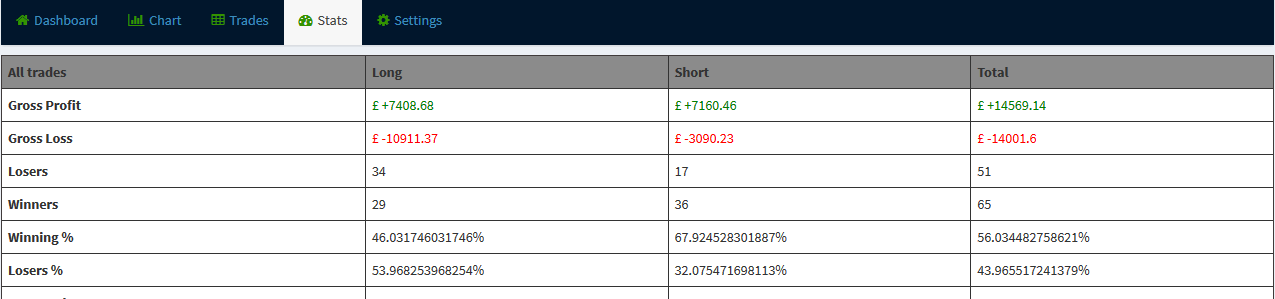
Stats
This section classifies all of your trades according to profit/loss and gives you an overall number so that you do not have to worry about crunching those numbers through repeated sorting and filtering. It contains sub-sections such as Summary, Periods and Symbols to further analyse numbers and give you a deeper analysis. For example, you might want to look at your portfolio’s performance during a particular year. Alternatively, you may want to see separate statistics for your profitable investments and those which have resulted in a loss.
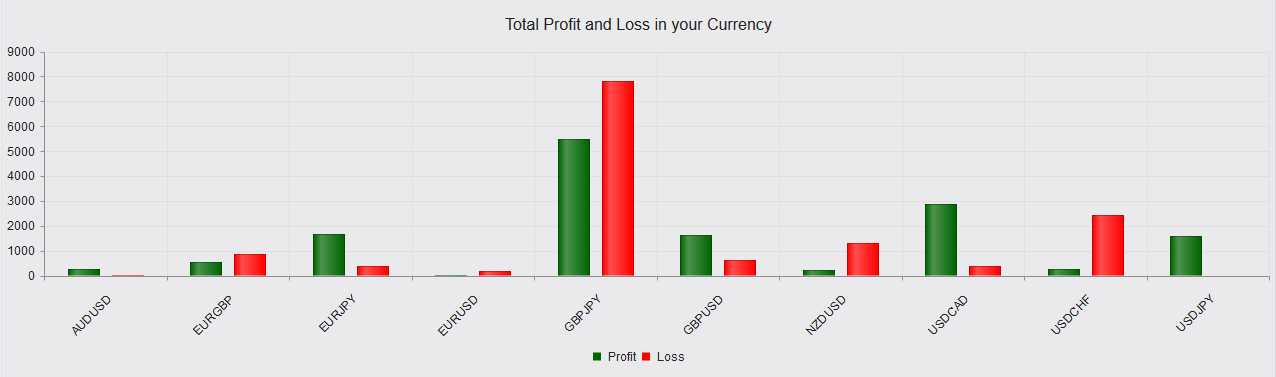
Charts
This section renders graphical representations of your profit and loss. Histograms can be further classified based on a number of parameters such as by instruments, hour, day of the week, day of the month, monthly and yearly. Current numeric values of profit or loss can be found by hovering the mouse over histograms. Moreover, profit and loss figures are available in your currency for easy understanding and analysis.
Settings
Separate from all of the number crunching and charts, this tab gives you control over your account. Whether you want to edit its name, description or delete it altogether, the Settings tab contains all these options in one area.
This was just a glimpse of the analysis put at your disposal by My Risk Mentor. Further documentation will contain a detailed description of the options available in each tab.